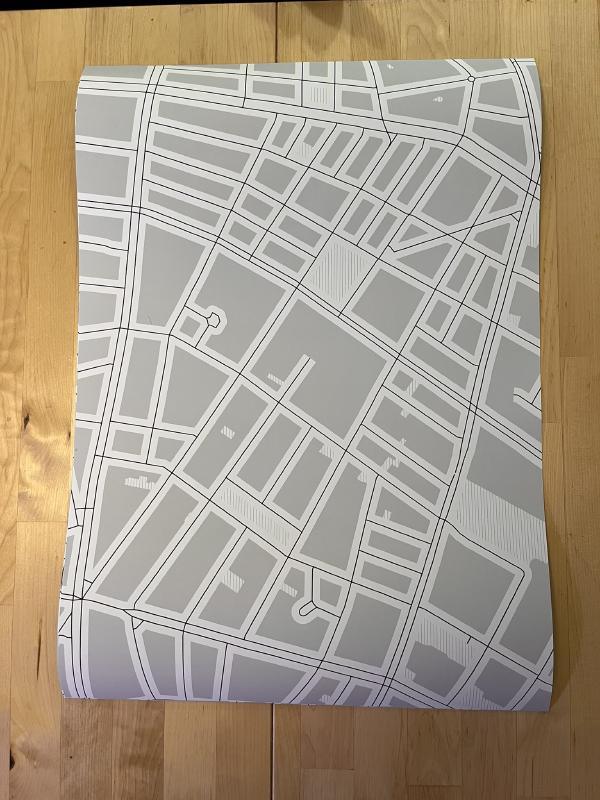
I wanted to let my children, who live in a dense, walkable neighborhood in Berlin, express themselves through maps.
I was inspired by the work of Bruce Appleyard, a researcher who asked children to draw maps of their daily lives. He observed two conclusions1:
- Children who primarily walk can accurately draw their neighborhood’s geography. Children who are usually driven perceive the world, rather, as disconnected places.
- In neighborhoods with fewer cars, children drew more landmarks and features such as trees. Conversely, areas with more cars were missing in detail.
With this in mind, I designed a mapping exercise for my 2- and 4-year-old children. They’ve already shown signs of being able to navigate the immediate neighborhood. It occurred to me that, for them, sidewalks are the most important part. To a four-year-old, even a quiet street is a formidable barrier. So, I wanted to find a way to render a map with oversized sidewalks and miniscule streets.
Enter OpenStreetMaps and a lovely piece of software called Maperitive. Maperitive lets you render OSM data to SVG, using a sophisticated styling language. I was able to select exactly the type of roads I wanted, and render them with a narrow “car space” and large “people space”. Then, I could produce a SVG and A2 PDF, which the local copy shop happily printed.
I intentionally omitted many features, with the intention of letting the kids fill them in. For example, we’ll work on drawing in transit lines ourselves. Playgrounds are only lightly highlited; we will label them together.
And, of course, I want to take the map with us as we navigate our neighborhood. Adventure awaits!
The maperitive style, if you’d like to reproduce this yourself:
features
	areas
		park: leisure=park AND NOT landuse=cemetery AND NOT access=private
        // needed because one playground is not listed as access=yes
        // TODO: Fix OSM data :-)
		park: leisure=playground AND (access=yes OR name=Schneckenspielplatz)

	lines
		str: @isOneOf(highway,primary,residential,secondary,tertiary,living_street) OR (highway=footway AND bicycle=yes)


properties
	map-background-color	: #D1D1D1
	map-background-opacity	: 1
	map-sea-color : #99B3CC
	map.rendering.lflp.min-buffer-space : 5
	map.rendering.lflp.max-allowed-corner-angle : 40

rules
//areas

	target:park
		define
			fill-hatch: vertical
			fill-hatch-color: white
			fill-color:#999999
			line-style: none
			line-width: 3
			line-color: white
		draw:fill
//lines
	target:str
		define
			min-zoom: 10
			line-width: 50
			line-color: #FFFFFE
			line-end-cap: round
		draw:line
		define
			min-zoom:10
			line-width: 3
			line-color:#333333
		draw:line
And, if you’re just getting started with Maperitive, here is the script to download and render the data
move-pos x=13.425 y=52.546
zoom 15.45
set-geo-bounds 13.411209322245,52.5378511105578,13.431090677755,52.5549484720452
download-osm-overpass bounds=13.411209322245,52.5378511105578,13.431090677755,52.5549484720452
save-source source.osm

clear-map

use-ruleset location=KidMaps.mrules
load-source source.osm
zoom 15.45 // YMMV
set-paper type=A2 orientation=portrait margins=5,5,5,5
set-geo-bounds 13.4114497255764,52.5379973325601,13.4308502744236,52.5548023065046
set-print-bounds-paper map-scale=3200

export-svg compatibility=inkscape file=out.svg
Finally, convert to a PDF with Inkscape and you’re good to go!

